
BEST Ai tools for data analysis
Tools I found pretty useful on my way to become a data analyst
8 tools
2 subscribers
Subscribe
Author

Monika Den
🙏 6 karma
-
 Oran Kangas🙏 3 karmaJul 28, 2023@Programming HelperCode varies from run to run. Still it is a helpful app. You can specify coding languages that are not in the dropdown menu.
 -
```python import pygame import sys import time import random # Direction Constants UP = 1 RIGHT = 2 DOWN = 3 LEFT = 4 class SnakeGame: def __init__(self, width=800, height=600): self.width = width self.height = height self.snake = [(200, 200), (220, 200), (240, 200)] self.direction = RIGHT self.apple = self.set_new_apple() pygame.init() self.display = pygame.display.set_mode((width, height)) pygame.display.set_caption('Snake Game') self.font = pygame.font.Font(None, 36) def set_new_apple(self): while True: x = random.randint(0, self.width - 20) // 20 * 20 y = random.randint(0, self.height - 20) // 20 * 20 apple = (x, y) if apple not in self.snake: return apple def draw_snake(self): for pos in self.snake: pygame.draw.rect(self.display, (0, 255, 0), (pos[0], pos[1], 20, 20)) def draw_apple(self): pygame.draw.rect(self.display, (255, 0, 0), (self.apple[0], self.apple[1], 20, 20)) def draw_score(self): score = len(self.snake) - 3 text = self.font.render(f'Score: {score}', True, (255, 255, 255)) self.display.blit(text, (10, 10)) def update(self): for event in pygame.event.get(): if event.type == pygame.QUIT: pygame.quit() sys.exit() elif event.type == pygame.KEYDOWN: if event.key == pygame.K_UP and self.direction != DOWN: self.direction = UP elif event.key == pygame.K_DOWN and self.direction != UP: self.direction = DOWN elif event.key == pygame.K_LEFT and self.direction != RIGHT: self.direction = LEFT elif event.key == pygame.K_RIGHT and self.direction != LEFT: self.direction = RIGHT head = self.snake[-1] if self.direction == UP: new_head = (head[0], head[1] - 20) elif self.direction == DOWN: new_head = (head[0], head[1] + 20) elif self.direction == LEFT: new_head = (head[0] - 20, head[1]) elif self.direction == RIGHT: new_head = (head[0] + 20, head[1]) self.snake.append(new_head) if self.snake[-1] == self.apple: self.apple = self.set_new_apple() else: self.snake.pop(0) if (self.snake[-1][0] < 0 or self.snake[-1][0] >= self.width or self.snake[-1][1] < 0 or self.snake[-1][1] >= self.height or self.snake[-1] in self.snake[:-1]): print("Game Over") pygame.quit() sys.exit() def draw(self): self.display.fill((0, 0, 0)) self.draw_snake() self.draw_apple() self.draw_score() pygame.display.update() def run(self): clock = pygame.time.Clock() while True: self.update() self.draw() clock.tick(10) if __name__ == "__main__": game = SnakeGame() game.run() ```
-
 Hi Harrison, glad it worked out for you as expected. We've more templates in the pipeline to be released soon.
 -
 I was just trying to get a quick graph showing population evolution over the last 30 years, didn’t have the dataset ready, so I was hoping the tool could auto-fill something reasonable. But it literally gave me three values. Three?? For 30 years?? What kind of trend can I possibly see with that? If the tool offers to research the data, it should at least offer a full timeline. And when I pasted the data I found, it created a literally bar chart???
 -
 Automate data work and reporting with AI Agents. No data|coding skills required.Open
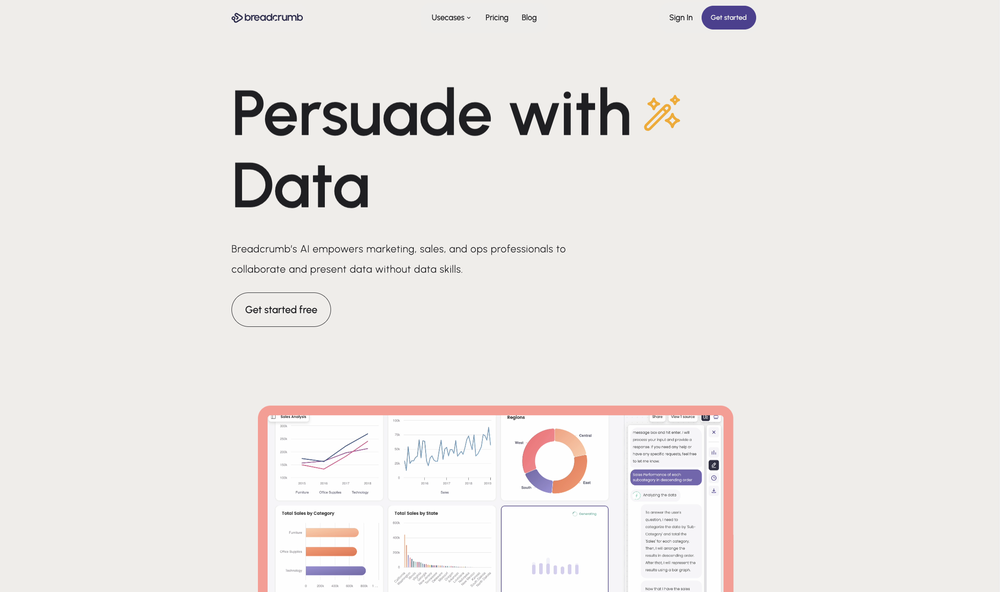 Signed up for a pro account for Google Drive integration. Works great! Saves me a lot of manual excel work.
 -
 Ask data questions, get instant insights, SQL, and charts — all poweredOpen
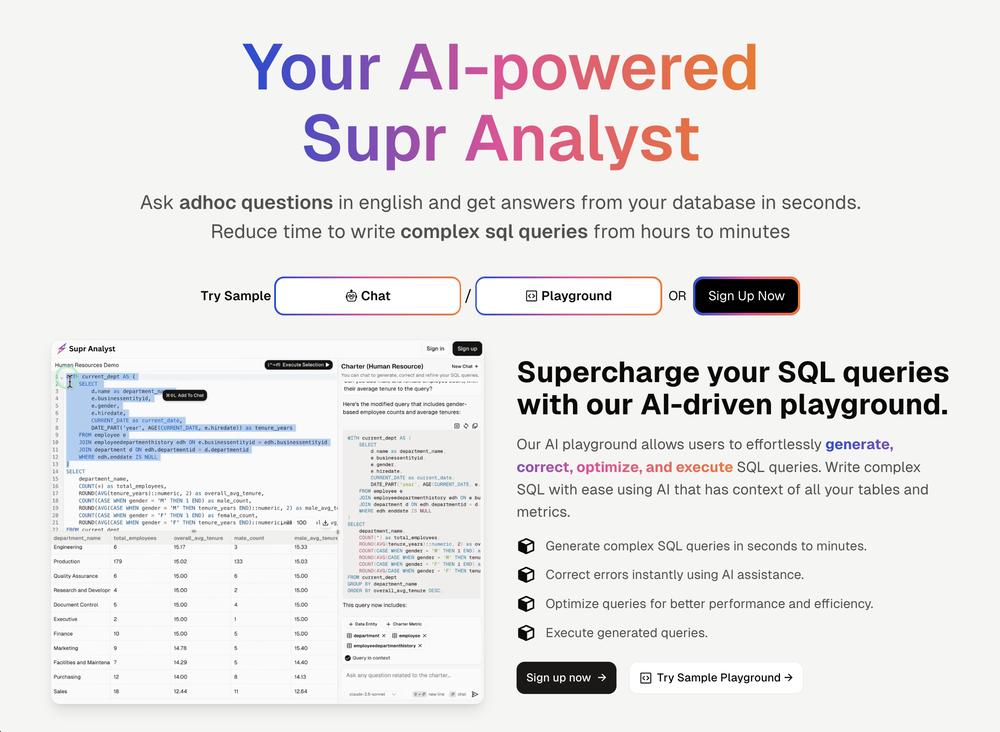 Got hands on the early version, database integration was smooth and it generates solid dashboards seamlessly along with AI powered optimised queries. Would recommend 10/10!
 -
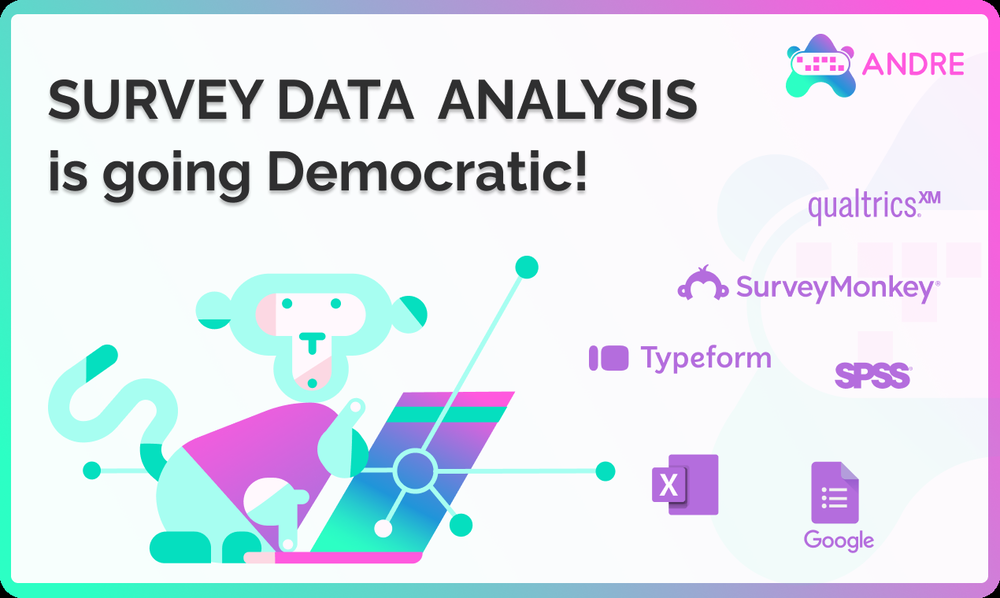 Great tool, offers a lot of data story suggestion and detailed charts.


