
NativeBI
Overview
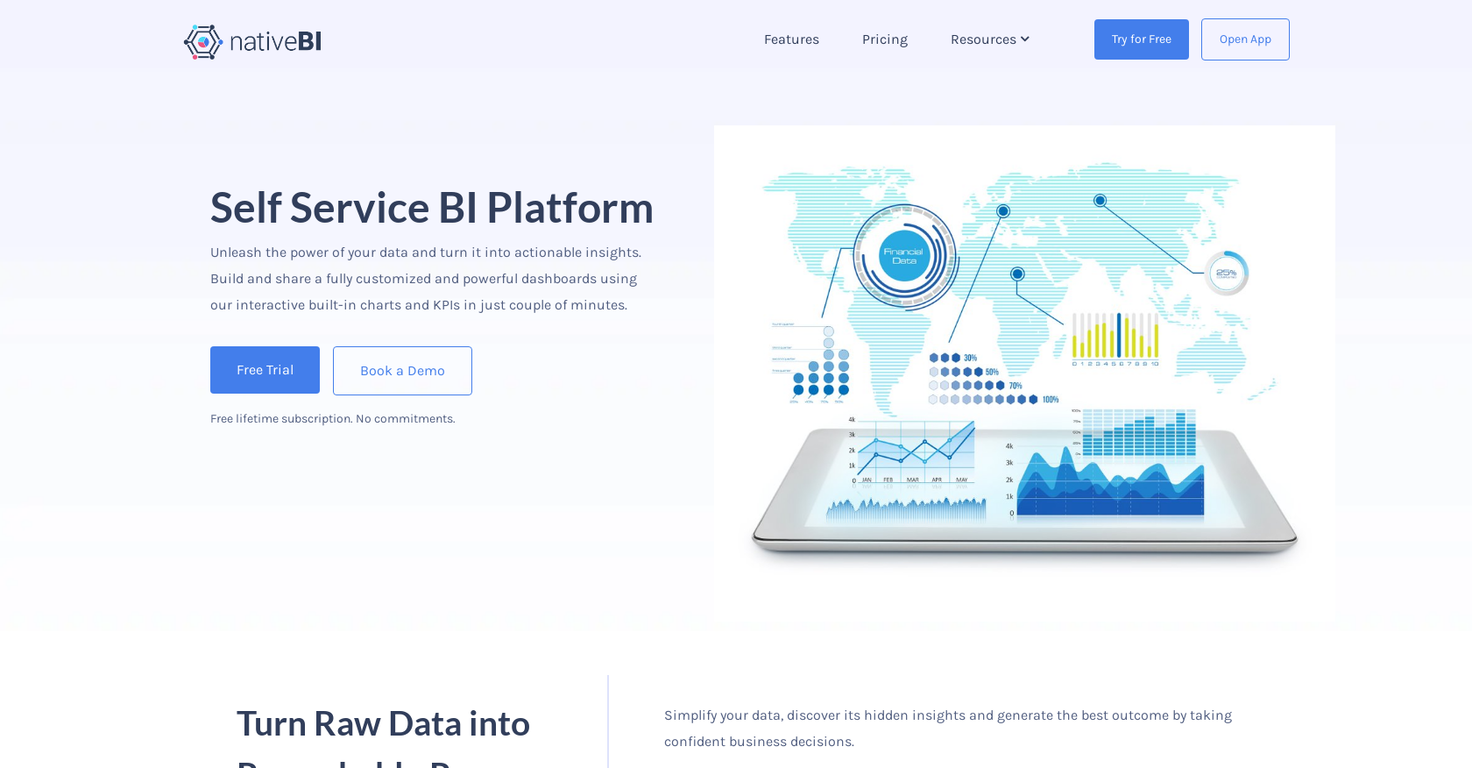
NativeBI is a self-service business intelligence platform designed to empower business leaders by providing them with the ability to visualize, study, and analyze their organization's data in one central location.
The platform offers interactive dashboards and key performance indicators (KPIs) for efficient data exploration. With NativeBI, users can build fully customized and powerful dashboards using interactive built-in charts and KPIs within minutes.
The tool simplifies data consolidation by combining internal and external data sources, allowing users to analyze these sources as a single entity. The platform also emphasizes data visualization, providing responsive and interactive dashboards that enable users to uncover hidden insights.
Additionally, NativeBI offers chat functionality powered by the ChatGPT model, enabling ad-hoc analysis using natural language.Collaboration features allow users to securely share dashboards and reports with their team, fostering coordination and informed decision-making.
NativeBI integrates seamlessly with various data sources, such as relational databases, spreadsheets, REST APIs, and cloud data sources. Its smart data extraction engine ensures up-to-date data exploration.
The tool supports unlimited viewers, enabling organizations to share dashboards and reports with an unlimited number of users at no extra cost. NativeBI offers flexible subscription plans suitable for different company sizes and is open to discussing customized plans and on-premise deployments.Ultimately, NativeBI aims to simplify complex data and transform it into actionable insights, making every user a power analyst.
Releases
Top alternatives
-
 Uncover hidden trends and patterns in your data effortlessly.Harishma Reghu🙏 7 karmaJan 13, 2024@Grapha AISuper useful tool that’s reduced my job by 80%
 -
 Data cleaning & visualization for insights gained.It is the ease of use for me. DataSquirrel is fast, the UI is super intuitive, and the guided analysis feature is highly convenient. I have officially moved from uploading CSV files from Google sheet to DataSquirrel. Within minutes, I can visualize my data and interpreting it becomes super simple.
 -
 Automate data work and reporting with AI Agents. No data|coding skills required.Signed up for a pro account for Google Drive integration. Works great! Saves me a lot of manual excel work.
 -
 AI data analysis workspace for business datasets and reports.Created a dashboard using my Excel file and it gave insights I didn’t even expect. It can read any kind of Excel file no matter the template. I can even check the accuracy by tracing back which column the data came from Great tool. highly recommended!!
 -
 Turn your data chaos into meaningful insightsImmo currently best solution if you want to convert / enchant your how-to tutorials to more professional!
 -
 AI-assisted graphs and insights in 30 seconds!I really value the sentiment analysis tool—it simplifies understanding customer feedback by picking up on their emotions. Plus, the way it groups comments into topics is super helpful for decision-making.


