Columns
 Chat with your data to get beautiful visualization.
Go to 📊 Data visualization
 StatPecker
 VibeChart
 Narraviz.ai
 LIDA
LIDA
 vizGPT
 PowerBI AI Lens
 Supadash
 ChatViz
 Tableau
 ChartFast
 Vizzy
Vizzy
 Magic Vizion
 Report Video Generator
 Consistence Image Generator
 Frequency vibes
 Graph Generator
 Data visualizer
 Market Survey Generator
 PowerBi interactive Dashboards
 Financial Graph Generator
34,755
23,775
18,463
5,080
4,237
4,115
2,916
2,837
2,215
1,868
989
671
513
353
95
52
49
34
31
29
Go to 💼 Business
📢
Marketing
(2299)
🔍
Industries
(953)
💾
Data
(891)
💼
Sales
(718)
💰
Finance
(397)
👔
Management
(307)
💡
Startups
(295)
⚖️
Legal
(251)
👔
HR
(239)
📈
Business strategy
(203)
📅
Meetings
(124)
📊
Product management
(119)
🔒
Security
(81)
📞
Calls
(42)
💻
Tech support
(37)
🤝
Networking
(36)
💻
Virtual employees
(27)
🤖
Enterprise
(16)
🚀
Business innovation
(13)
 Younet
 CleeAI
 Avataar's GenAI Creator
 Activepieces
 Kong.ai
 BigTeam
 Olivya
 Sreda.ai
 Abstra
 DoubleO
 AI Agents
 Pipefy
 Quixl
Quixl
 Cubeo
Cubeo
 Sema4.ai
 Ridvay
 Drast AI
 Cognition by Mindcorp
 Tray.io
 UiPath
146,340
14,257
4,426
4,176
3,312
3,056
3,026
2,644
2,619
2,550
2,491
2,350
1,864
1,793
1,627
1,429
1,301
1,160
810
541
Go to 💾 Data
📊
Data analysis
(225)
📂
Files
(211)
📊
Market research
(173)
🔍
Data extraction
(97)
📊
Data visualization
(64)
🗄️
Databases
(43)
📊
Data entry
(25)
🗄️
Data management
(24)
📊
Business analysis
(18)
🏷️
Data labeling
(5)
🔒
Data anonymization
(2)
🧩
Data modeling
(2)
🔀
Synthetic data
(2)
 genset
41
Columnsv2
Inputs:
Outputs:
Chat with your data to get beautiful visualization.
Overview
Overview
Socials:


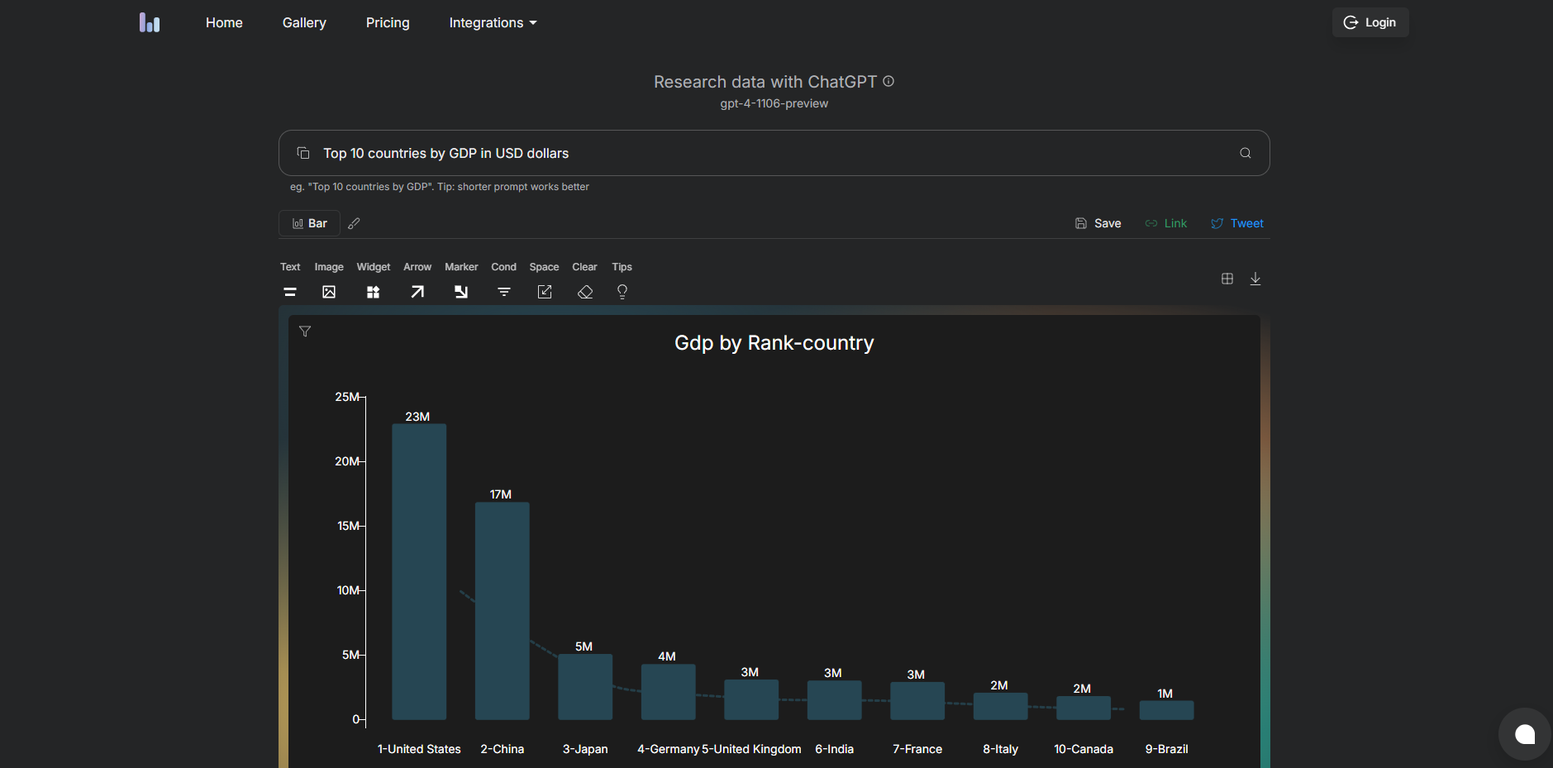
Columns: AI-Powered Data Visualization Made Simple
Columns is an advanced AI-driven data visualization platform that transforms how you analyze and present data. With natural language input, you can create stunning visualizations effortlessly—no coding or complex tools required.
Seamless Workflow:
1. Connect various data sources effortlessly.
2. Chat with AI to generate insightful analyses and visualizations.
3. Customize with flexible branded themes and styles.
4. Tell compelling stories with powerful storytelling tools.
5. Share and embed interactive data stories with ease.
See It in Action
🚀 Watch a 1-minute demo: https://youtu.be/4kbO5mXxOeY
📊 Explore charts: https://app.fina.money/url/mvjPmeKzw1Cark
Show more
Releases
Get notified when a new version of Columns is released
Notify me
Mar 4, 2025
May 3, 2023

Shawn Cao
Initial release of Columns.
Author


Follow
Pricing
Pricing model
Freemium
Paid options from
$75/year
Billing frequency
Yearly
Top alternatives
-
Harrison Oliver🙏 24 karmaJun 12, 2025@StatPeckerI felt there is need of more ready made templates. But, it does what it claims. I chose one question suggested by the AI agent, and it created the infographics in few seconds. It's cool. Saving it for future reference.
-
I was just trying to get a quick graph showing population evolution over the last 30 years, didn’t have the dataset ready, so I was hoping the tool could auto-fill something reasonable. But it literally gave me three values. Three?? For 30 years?? What kind of trend can I possibly see with that? If the tool offers to research the data, it should at least offer a full timeline. And when I pasted the data I found, it created a literally bar chart???
-


#66
 1
1


