Who can benefit from using columns.ai?
Columns.ai is beneficial for a wide range of users. It is especially useful for researchers, analysts, and students who frequently handle complex data and need to transform it into meaningful insights. Furthermore, individuals desiring to quickly understand and visualize web content can benefit from using this tool.
Does columns.ai operate on other browsers or only on Google Chrome?
Columns.ai operates exclusively on the Google Chrome environment. There is no information available indicating that it works on other browsers.
Does columns.ai interact directly with web content?
Yes, Columns.ai interacts directly with web content. By using this extension, you can highlight any text, paragraph, or table on a web page, and Columns.ai will then convert the selected content into an interactive data visualization.
What kind of data can columns.ai visualize?
Columns.ai can visualize any highlighted paragraph, table, or text on a web page. There are no specific types of data mentioned on their website, which suggests that as long as the content can be highlighted, it can be visualized by Columns.ai.
How can I activate the 'Magic Vizion' feature in columns.ai?
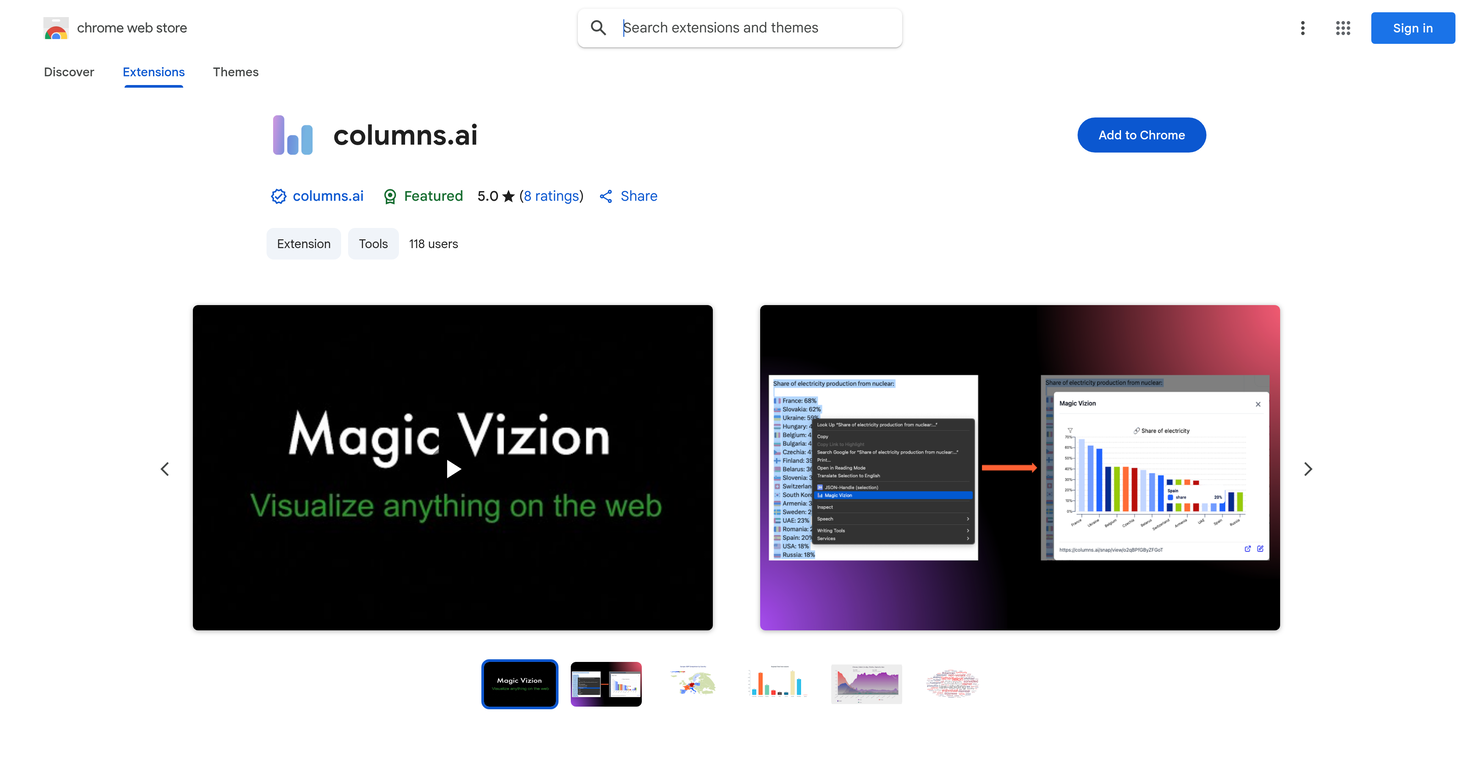
To activate the 'Magic Vizion' feature in Columns.ai, users need to highlight the desired paragraph, table, or text on a web page, right-click, and select 'Magic Vizion'. 'Magic Vizion' will then analyze the chosen information and instantly create a dynamic visual representing the data.
How does columns.ai help in understanding complex web data?
Columns.ai aids in understanding complex web data by converting it into dynamic charts or visuals. By visualizing the selected information, users can gain a clearer, more immersive comprehension of the data and thereby derive meaningful insights.
Can columns.ai visualize textual content from a webpage?
Yes, Columns.ai can visualize textual content from a webpage. If you highlight a paragraph, table, or the text on any webpage, 'Magic Vizion' will analyze and convert it into an instant interactive data visualization.
How fast can columns.ai transform information into insights?
Columns.ai is designed to transform information into insights rapidly. The exact time it takes is not specified on their website, but the process is intended to be quick and efficient, providing users with immediate visual representations of their selected data.
How does columns.ai handle user's personal data?
There is a disclosure on the developer's privacy policy regarding the probable collection and usage of user data by the extension. However, the exact details have not been specified on their website.
What's the privacy policy of columns.ai?
Columns.ai has disclosed in its privacy policy that it may collect and use your data. More detailed information could be found in the developer's privacy policy. Yet, the specifics are not provided in the given data.
Does columns.ai sell the data it collects?
According to the details given, Columns.ai declares that users' data is not being sold to third parties, outside of the approved use cases. However, it is advised to go through the developer's privacy policy for a comprehensive understanding.
How can columns.ai assist in academic research?
Columns.ai can assist in academic research by transforming complex data found on web pages into clear, dynamic charts or visuals. For researchers who need to handle and understand vast amounts of information, this tool provides an efficient way to visualize the data and gain insights rapidly.
What is Columns.ai?
Columns.ai is a Google Chrome extension that enables users to convert any highlighted section of a web page into interactive data visualizations instantly. This feature, also known as 'Magic Vizion', analyses the selected information and turns it into an engaging chart or visual, intended to provide a more comprehensive and immersive understanding of online data.
How does Columns.ai work?
Columns.ai works by analyzing selected web content and transforming it into a dynamic visual representation. Users start by installing the extension on their Chrome browser, then highlight any paragraph, table, or text on a web page they wish to visualize. Upon right-clicking and selecting 'Magic Vizion', the tool automatically analyzes the selection and turns it into a clear, dynamic chart or visual.
How do I activate 'Magic Vizion' on Columns.ai?
To activate 'Magic Vizion' on Columns.ai, highlight any part of a web page's content that you wish to visualize, then right-click the highlighted section and select 'Magic Vizion' from the context menu.
Can I customize the visualization produced by Columns.ai?
Yes, you can customize the visualization produced by Columns.ai. After creating a visualization using 'Magic Vizion', it can be opened in a new tab where you can tailor it according to your needs.
How do I save a visualization on Columns.ai?
To save a visualization in Columns.ai, create the visualization using 'Magic Vizion', it will then open in a new tab from where you can save it for future reference.
How do I share a visualization from Columns.ai?
You can share a visualization from Columns.ai by first creating and customizing the visualization. Once the visualization opens in a new tab, you can then share it directly from there.
What type of web content can be visualized with Columns.ai?
Any highlighted paragraph, table, or text on a webpage can be visualized with Columns.ai.
Who can benefit from using Columns.ai?
Individuals who often interact with complex data or want to swiftly convert information into meaningful insights can benefit from using Columns.ai. It serves as a useful tool for researchers, analysts, students, and more.
Is there any user support provided by Columns.ai, and how can it be reached?
Yes, user support is provided by Columns.ai. Queries, feedback, or questions can be directed to the Columns.ai support team via email at
[email protected].
Does Columns.ai collect user data?
According to the developer's privacy policy, Columns.ai might collect and use user data.
What is stated in the privacy policy of Columns.ai?
The privacy policy of Columns.ai details the collection and usage of user data. The specifics include what information is collected, how it is used, where it's stored, and more.
How is Columns.ai beneficial for researchers, analysts, and students?
Columns.ai is beneficial for researchers, analysts, and students as it offers a quick and easy way to visualize complex data. Information that may be difficult to understand when read in text format can be transformed into a clear, interactive visual representation, aiding in faster comprehension and better insights.
What does an interaction between users and Columns.ai entail?
The interaction between users and Columns.ai involves the user installing the Columns.ai extension on their Chrome browser, highlighting the web content they wish to visualize, and running the 'Magic Vizion' command through a right-click.
What types of visuals does 'Magic Vizion' create in Columns.ai?
'Magic Vizion' in Columns.ai creates dynamic charts and visuals based on the web content selected by the user.
How do I install the Columns.ai extension on Chrome?
To install the Columns.ai extension on Chrome, go to the Chrome web store, search for Columns.ai, and then click on 'Add to Chrome'. Follow the prompts to complete the installation.
How does Columns.ai transform web content into a visual representation?
Columns.ai transforms web content into a visual representation by analyzing the highlighted information and then converting it into a dynamic chart or visual.
What are the steps to generate a visualization using Columns.ai?
To generate a visualization using Columns.ai, first install Columns.ai on your Chrome browser. Next, highlight any paragraph, table, or text on a web page. After highlighting, right-click and select 'Magic Vizion'. Columns.ai will then analyze your selection and transform it into a visual representation.
What is the best way to select web content for visualization in Columns.ai?
The best way to select web content for visualization in Columns.ai is to highlight any part of it, such as a paragraph, table, or text, that you find informative or intriguing. The highlighted section can then be transformed into a visual using 'Magic Vizion'.
How is Columns.ai different from other data visualization tools?
Columns.ai, unlike other data visualization tools, operates directly in the browser environment and focuses on creating visualizations from web content. It features 'Magic Vizion' that transforms selected web content into dynamic visuals in an instant, making it a convenient and quick tool for casual or beginner users and professionals alike.

 Intelligently visualize anything on the web