Columnsv2
Data visualization
34,762
4.1
Inputs:
Outputs:
Gemini 2.0 Flash Thinking Experimental
Chat with your data to get beautiful visualization.
Overview

Featured alternatives
 Text to Infographic
 ExcelDashboard AI
14,141
3,844
Overview
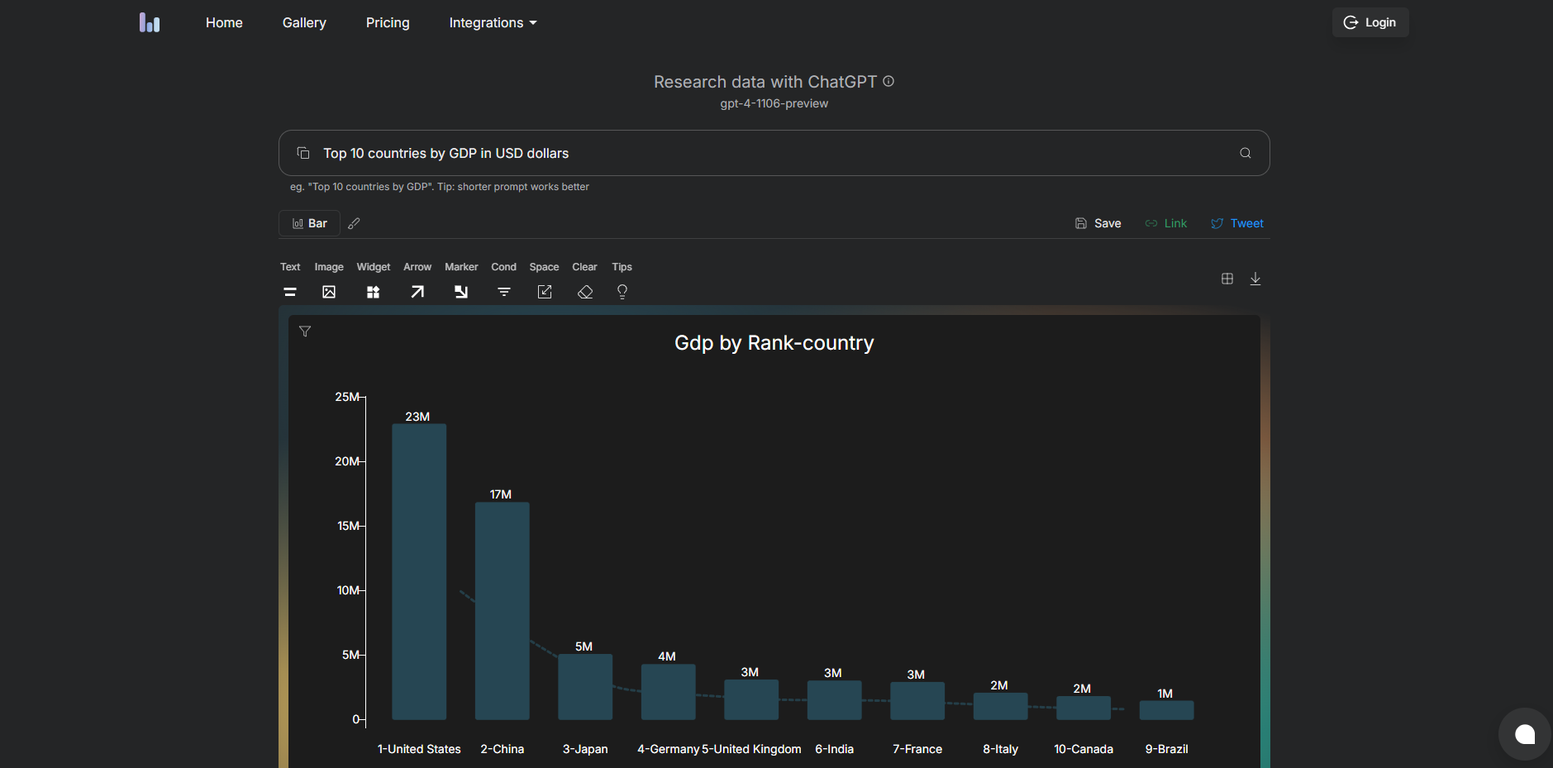
Columns: AI-Powered Data Visualization Made SimpleColumns is an advanced AI-driven data visualization platform that transforms how you analyze and present data. With natural language input, you can create stunning visualizations effortlessly—no coding or complex tools required.
Seamless Workflow:
1. Connect various data sources effortlessly.
2. Chat with AI to generate insightful analyses and visualizations.
3. Customize with flexible branded themes and styles.
4. Tell compelling stories with powerful storytelling tools.
5. Share and embed interactive data stories with ease.
See It in Action
🚀 Watch a 1-minute demo: https://youtu.be/4kbO5mXxOeY
📊 Explore charts: https://app.fina.money/url/mvjPmeKzw1Cark
Show more
Releases
Get notified when a new version of Columns is released
Notify me
Mar 4, 2025

Shawn Cao
🚀 Columns Update: Now Powered by Gemini 2.0 Flash!
We've integrated Gemini 2.0 Flash to deliver a smoother, faster AI chatting experience in Columns. Now, through AI chat, you can:
Preview your data samples effortlessly.
Get analysis suggestions for data visualization.
Refresh your graphs with AI-generated themes and styles.
🔥 More Exciting Improvements:
Enhanced time series analysis for deeper insights.
Easier customization across all chart types.
New data transformations to explore your data from different perspectives.
Try it out today and start chatting with Columns!
🎥 Watch the 1-minute demo: https://youtu.be/1cugv1C8Ji0
May 3, 2023

Shawn Cao
Initial release of Columns.
Data visualization
34,762
4.1Top alternatives
-
27,93996Released 4mo ago100% FreeHarrison Oliver🙏 23 karmaJun 12, 2025I felt there is need of more ready made templates. But, it does what it claims. I chose one question suggested by the AI agent, and it created the infographics in few seconds. It's cool. Saving it for future reference.
-
21,16023Released 3mo agoFree + from $20/moI was just trying to get a quick graph showing population evolution over the last 30 years, didn’t have the dataset ready, so I was hoping the tool could auto-fill something reasonable. But it literally gave me three values. Three?? For 30 years?? What kind of trend can I possibly see with that? If the tool offers to research the data, it should at least offer a full timeline. And when I pasted the data I found, it created a literally bar chart???
-
4,08021Released 2y ago100% Free
-
3,66436Released 2y agoFree + from $15/mo
-
2,77552Released 1y agoFree + from $10/mo
-
2,12926Released 1y agoNo pricing


