
EzyGraph
Overview
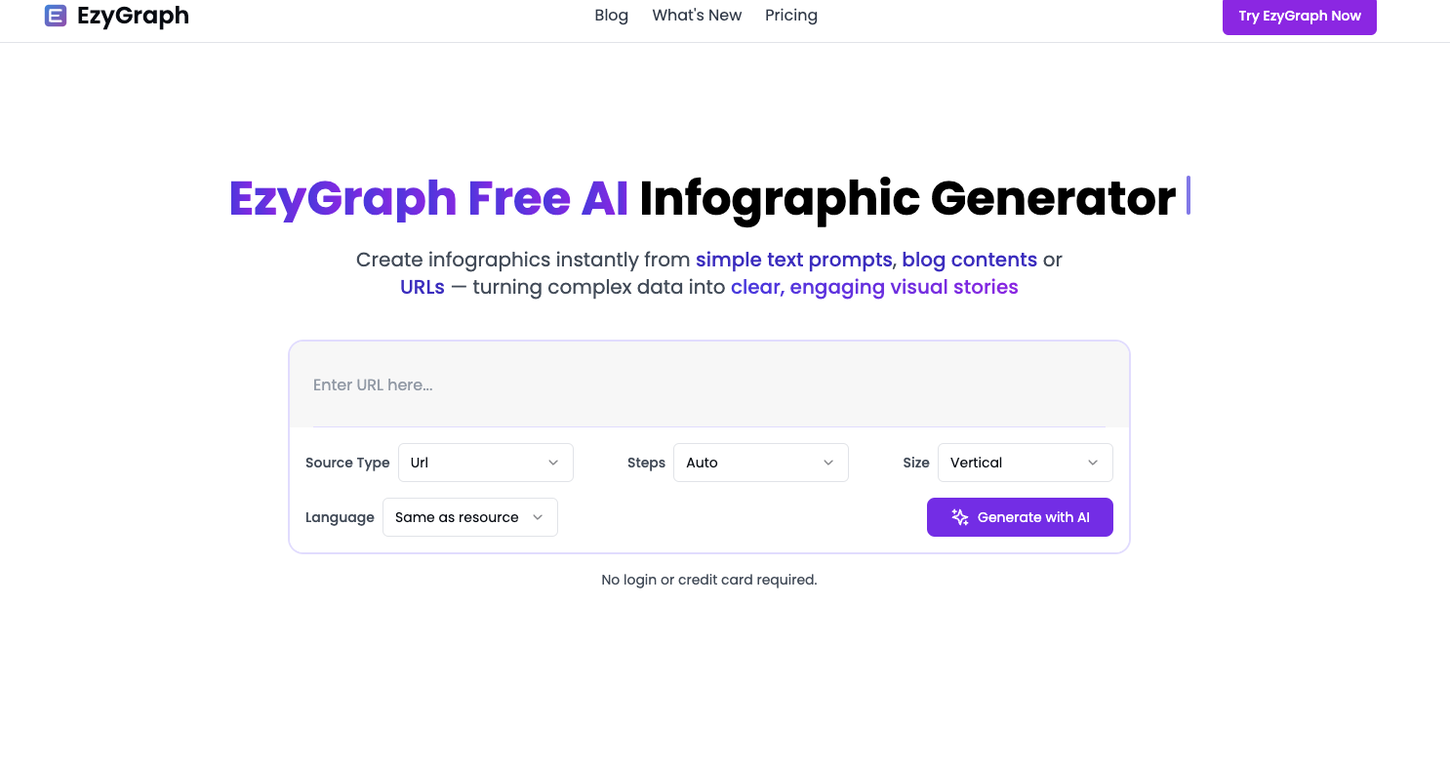
EzyGraph is an AI-powered infographic generator designed to turn blog contents, articles, or web pages into polished, visual stories instantaneously. It allows users to create infographics simply by inputting their content or URL, which the AI system then analyzes and constructs into drafts that reflect the key points.
EzyGraphs design can be customized according to the user's preferences with options to edit layout, text, and color schemes to match their vision. Users can download the final professionally designed infographic for distribution on blogs, social media, or presentations.
Additionally, EzyGraph features an 'intelligent icon matching' system where the AI will suggest suitable icons to accompany the content from their extensive icon library.
There is also a custom template option where users can save their templates, leading to consistently styled infographics. The platform positions itself as an ideal tool for content creators, bloggers, educators, trainers, marketing teams, social media managers, and business professionals looking to present data and content in a visually appealing and accessible medium.
Releases
Top alternatives
-
 Generate infographics from keywords instantly.
 Gay Shirer🙏 9 karmaNov 22, 2023@Infographic NinjaIt took me less than 20 minutes to create infographic perfection- all the other AI design sites I tried, and I tried them all, weren't able to give me what I wanted in 1 way or another. Outline Ninja helped me create my infographic
 -
 AI infographic generator that turns blog posts into link magnets
 -
 Create infographics instantly from text promptsI had to tweak a few things to match my brand style, but overall it saved me a ton of time. Definitely handy if you need something fast and professional-looking.
 -
 Transform unstructured text into knowledge graphs with AI.I wasn't able to use this one (I have my API key)
 -
 Visually appealing infographics with ease.
 -
 Turn your text into visuals in minutes.Which is more valuable, time or money? This doesn't save you either, at the moment as you only get two infographics to test out and you have to do quite a bit of editing to get it to look ok. The point of infographics is to inform in a highly visual and compelling way. None of the example info graphics are that. I suggest a pivot and use AI to fill out the text in a pre-made graphic template.


