

▼ Most saved
Visual ideation
Free mode
100% free
Freemium
Free Trial
Featured matches
-
 Poojitha Bandaru🙏 8 karmaDec 26, 2025@ColumnsUI Experience is fast & good with free account limited data (100 csv records) but no 3rd party integrations and limited data connection and no 3D /funnel many more chart visualizations are missing.
 -
Waitlist
 Open
Open
-
 AI-powered social media creation, scheduling, and optimization in one placeOpen
-
 Make Better Decisions with Data-Driven Charts, Clear Explanations, and Insightful AnalysisOpen
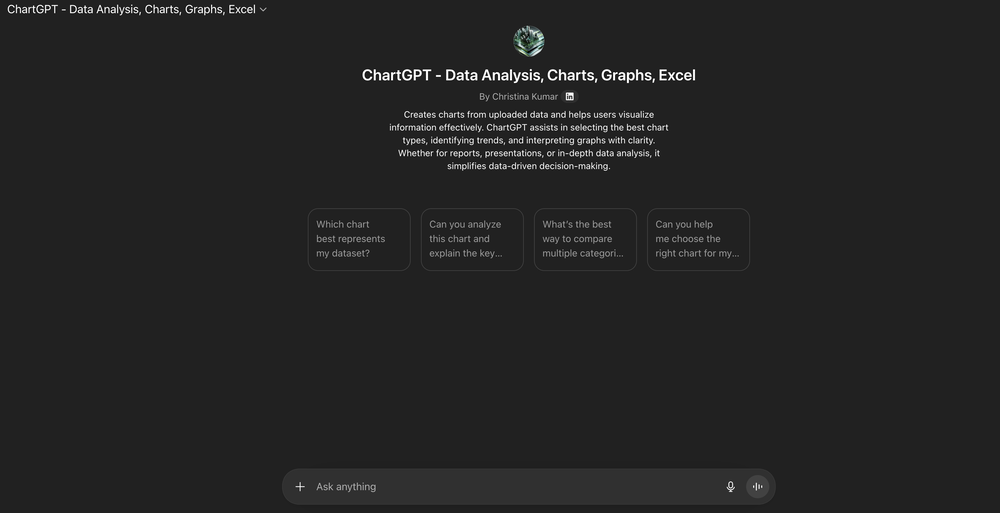 Efficient for charts, graphs, and data analysis.
 -
-


Other tools
-
-
When I want to sign up on the Ideogram website with "Continue with Google" and press it, the sentence "Please choose an option to continue" appears below the banner and no action happens. Anybody can help me?
-
 Transform ideas into cinematic prompts for video production.Open
 - Sponsor
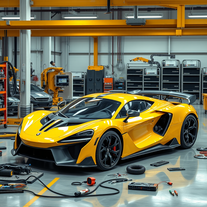
 Rocket - Think it. Type it. Launch it.
 -
Poor images. Not even come closer to the ask
-
 OpenReally great number pattern generator. We have taken your tool and made some advanced changes here - https://texttoolz.com/tools/number-pattern-generator
 -
I felt there is need of more ready made templates. But, it does what it claims. I chose one question suggested by the AI agent, and it created the infographics in few seconds. It's cool. Saving it for future reference.
-
 Open
Open - Didn't find the AI you were looking for?
-
Was very useful for my class assignment. Very easy to edit on and the AI converts sketches into great wireframes.
-
 Visualize scientific concepts with AI-generated imagery.Open
 -
 Transform text into surreal pen-and-pencil sketches with watercolor washes.Openhmmm yeah great, i'm sure i could also recreate these in real life, with pencils
 -
I am able to summarize a complex paper into a one-pager visual. Before this tool: hours of reading and summarizing. After this tool: I grasp something complex in seconds. Thank you!!!
-
Looks promising but found it very slow to load and create templates and previews
-
-
I was just trying to get a quick graph showing population evolution over the last 30 years, didn’t have the dataset ready, so I was hoping the tool could auto-fill something reasonable. But it literally gave me three values. Three?? For 30 years?? What kind of trend can I possibly see with that? If the tool offers to research the data, it should at least offer a full timeline. And when I pasted the data I found, it created a literally bar chart???
-
Very helpful tool in my design process and coming up with new features!
-
 AI-generated Indian deity avatars blending tradition with modernity.Open
 -
 Open
Open -
-
Hi Taaft community! I’m the creator of ConceptViz. We built this tool specifically for educators and researchers who deal with complex information daily. ConceptViz uses AI to instantly transform dense lesson plans, curriculum notes, or research frameworks into clear, structured diagrams. Our goal is to help K12 teachers make abstract concepts tangible for students and to help researchers map out logical workflows without the manual drudgery of drawing. I’d love to hear how this fits into your academic or classroom workflow—your feedback will help us build a better tool for the education community! 🚀
-
 AI-powered microscope for ultra-realistic nano-visuals.Open
 -
I really gotta let my heart out, got so many great reviews from my peers. It has helped me make my school work so much easier. I work with little children so when i make it cartoonish it's giving me the best one's yet.
-
 Transform molecular visualization requests into precise PyMOL commands.Open
 -
 Transform dream home ideas into stunning architectural visualizations.Open


Post


