

▼ Latest
Animated charts
Free mode
100% free
Freemium
Free Trial
Featured matches
-

-
 AI-powered Excel analysis and visualization in natural languageOpen
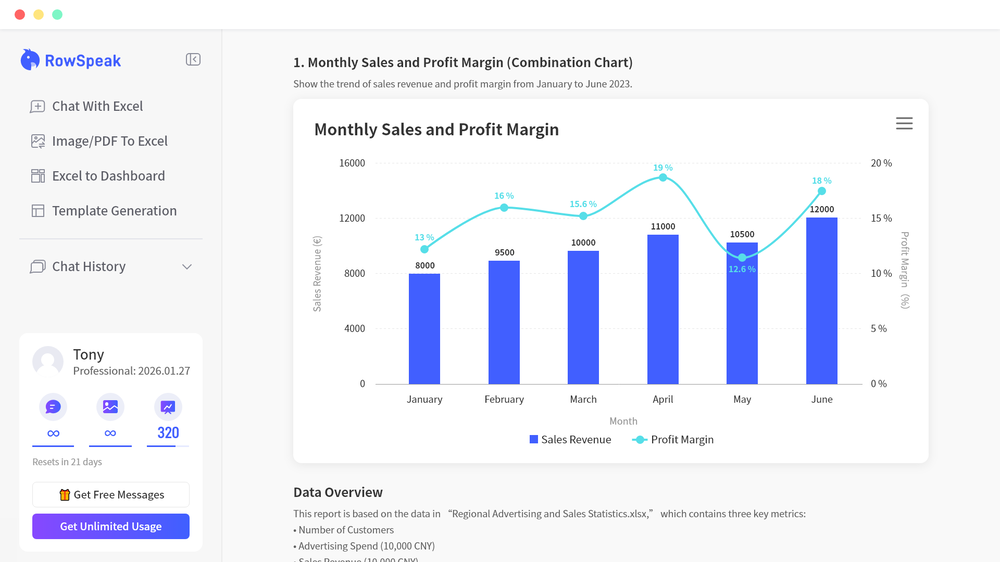 New Features & Improvements 1. New Dashboard Experience Added a powerful Dashboard feature. Users can now upload Excel or CSV files and get a clean, professional-looking data dashboard in just a few seconds. Automatically generates charts, key metrics, and summaries to help you understand your data at a glance. 2. Image/PDF to Table Conversion Added support for image-to-table conversion: turn table images into editable Excel data. Added support for PDF-to-table conversion: extract tabular data from PDFs into structured spreadsheets. Greatly reduces manual copy‑and‑paste work from screenshots and documents. 3. Faster, Smarter Data Processing Optimized the backend engine for faster response times. Improved data interpretation for more accurate and intelligent handling of complex tables and edge cases. Better performance for large files and multi-step transformations. 4. Enhanced Excel Editing & Data Cleaning Now supports editing Excel file styles, including formatting, cell styles, and layout adjustments. Added data cleaning tools to quickly remove duplicates, standardize formats, fix common errors, and tidy messy datasets. Makes it easier to go from raw data to polished, ready-to-use spreadsheets.

Verified tools
-
Sophia🙏 48 karmaApr 7, 2025@AI Infographic GeneratorI had to tweak a few things to match my brand style, but overall it saved me a ton of time. Definitely handy if you need something fast and professional-looking.

Other tools
- Spotlight: Uppercopy (Social media posts)
-
I was just trying to get a quick graph showing population evolution over the last 30 years, didn’t have the dataset ready, so I was hoping the tool could auto-fill something reasonable. But it literally gave me three values. Three?? For 30 years?? What kind of trend can I possibly see with that? If the tool offers to research the data, it should at least offer a full timeline. And when I pasted the data I found, it created a literally bar chart???
-
This one was really nice. In that it could also generate a white paper to go with the diagram
-
-
Great tool for getting some initial information about your data, especially in the beginning phase when your main goal is to explore your data
-
-
-
 Openthe kids really liked it, they started drawing a lot of pictures, trying to bring them to life - it turns out fantastic! it's important that there is one character in the picture
 - Didn't find the AI you were looking for?


Post


