

▼ Latest
Data dashboard
Free mode
100% free
Freemium
Free Trial
Featured matches
-
 Open
Open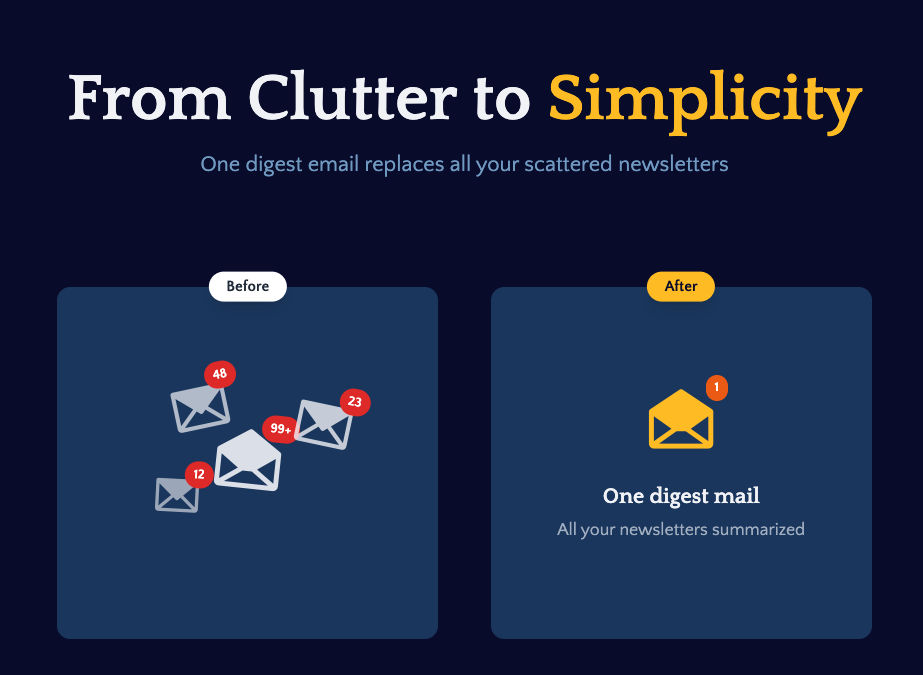 Benedikt Scheungraber🛠️ 1 tool 🙏 36 karmaAug 20, 2025@Remy - Newsletter summarizerI built Remy to solve a problem I face every day: Newsletter overload 📬 Remy is your personal AI assistant that summarizes all your newsletters into a single digest email. Go from a cluttered inbox to a clear, concise briefing in one go.
 -

-
-

-

-
-


Verified tools
-
 Automate data work and reporting with AI Agents. No data|coding skills required.OpenSigned up for a pro account for Google Drive integration. Works great! Saves me a lot of manual excel work.
 -
Thank you for your feedback! Super excited to see how you get on with Bizzy!
-
- Spotlight: Uppercopy (Social media posts)
-
Super clean UX and really nice onboarding!
-
 Ask data questions, get instant insights, SQL, and charts — all poweredOpen
 -
-
-
great in Slack or Teams to quickly fetch data and get visualizations
-
I really like DataLine, but I'm kinda biased cause I built it.
-
 Empower your investment strategies with AI signals, option flow data, and advanced chart patterns.OpenOver-priced for what it promises to do. Other AI powered services, at more affordable prices, or cheaper, some with incredible track records and scientists with great track records.
 -
It is the ease of use for me. DataSquirrel is fast, the UI is super intuitive, and the guided analysis feature is highly convenient. I have officially moved from uploading CSV files from Google sheet to DataSquirrel. Within minutes, I can visualize my data and interpreting it becomes super simple.


Other tools
-
No information about the company or its leadership anywhere on the site...very low trust factor.
-
-
Such a powerful tool with free account, all your data analysis needs with an easy intuitive itnerface
- Didn't find the AI you were looking for?
-
-
Very powerful, it not only gets data magically for your nl question but also builds a nice visual tailored to that data. Impressive.
-
AVOID AT ALL COSTS. Amateur hour if I ever saw it: they change their entire API endpoints on a whim on the SAME VERSION, breaking all of the work you've done to integrate with them (thousands of $), then tell you you're not an $5k / month Enterprise customer and they don't really support their self serve product so...tough luck buddy. I was one of their first customers and have been using them for over a year and a half only to wake up one day to customer complaints because our integration had broken and be told they basically don't care about. After I reached out to their team, it became clear that they had simply changed their entire API from one day to the next on the same version, with no notice and a documentation that doesn't reflect the changes they made. Literally everything is broken in one way or another: the UI fails to save changes every other try, the API has three different versions in use at the same time, some endpoints use v3 others use v4, similar payload responses don't even reply with the same structure for the data, the documentation is completely out of sync with the actual endpoints, the webhooks trigger 3 times in a row and on and on and on... Somehow they have several engineers, yet no-one there actually knows how to fix your problem. I've been a customer for over a year and a half and after breaking my entire integration, they just told me to go take my business elsewhere because they couldn't support their OWN breaking changes! Oh and by the way, it took a week of back and forth and trying to fix my integration and work with their broken documentation to tell me this. Total insanity. I couldn't ever imagine being an Enterprise customer with these people, their whole product is built on a shoestring and they have absolutely no respect whatsoever for their customers.
-
-
I was just trying to get a quick graph showing population evolution over the last 30 years, didn’t have the dataset ready, so I was hoping the tool could auto-fill something reasonable. But it literally gave me three values. Three?? For 30 years?? What kind of trend can I possibly see with that? If the tool offers to research the data, it should at least offer a full timeline. And when I pasted the data I found, it created a literally bar chart???


Post


