

▼ Most saved
Data visualization
Free mode
100% free
Freemium
Free Trial
Featured matches
-
 Poojitha Bandaru🙏 6 karmaDec 26, 2025@ColumnsUI Experience is fast & good with free account limited data (100 csv records) but no 3rd party integrations and limited data connection and no 3D /funnel many more chart visualizations are missing.
 -
 This is truly a wonderful experience that brings joy and delight.
 -
-
 👋 Hey, I'm the founder of Flowova! We built this because we were tired of spending hours dragging boxes in traditional flowchart tools. A few things you might not know: - Works with anything — text, images, PDFs, Word, PPT, Excel, even photos of whiteboard sketches - 40+ themes designed for presentations - Full Mermaid code support for developers Happy to answer any questions! 🚀
 -
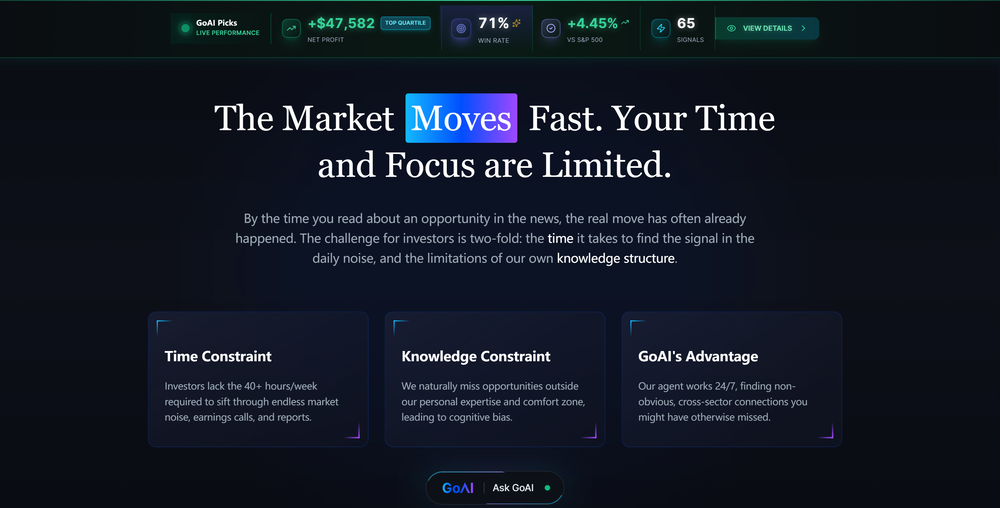 GoAI turns market noise into transparent, actionable investment logic. Go check your favorite stock for an instant deep-dive and see what the AI reveals. Feedback welcome!
 -
-

-
 AI-powered analytics that unlock smarter business insights.Open
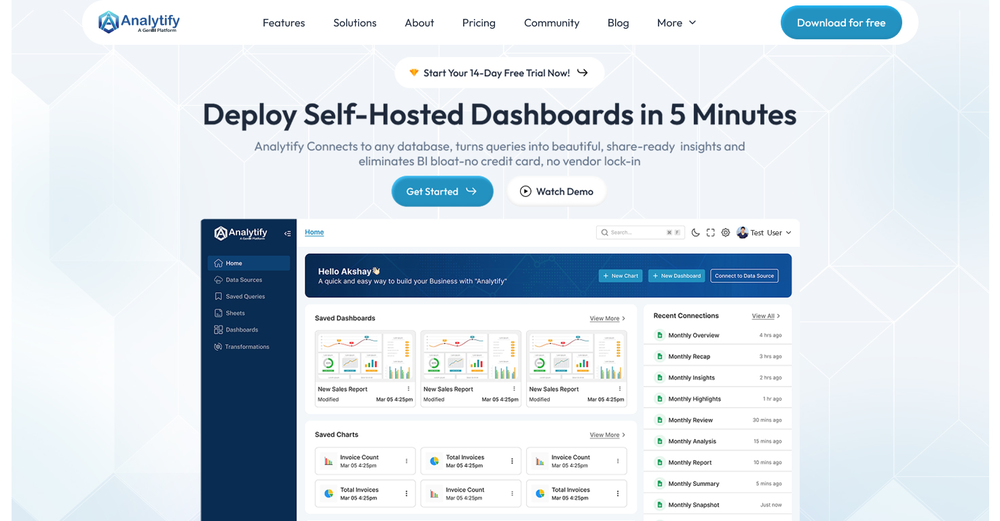 I used Analytify and found it incredibly easy to set up and integrate with Google Analytics, giving me real-time stats and page-level insights without needing any coding knowledge.
 -
-
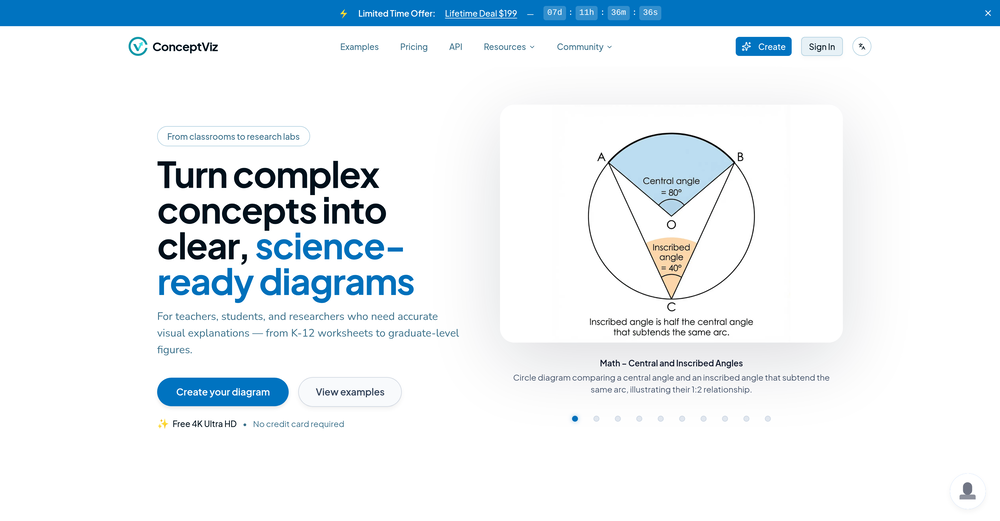 Hi Taaft community! I’m the creator of ConceptViz. We built this tool specifically for educators and researchers who deal with complex information daily. ConceptViz uses AI to instantly transform dense lesson plans, curriculum notes, or research frameworks into clear, structured diagrams. Our goal is to help K12 teachers make abstract concepts tangible for students and to help researchers map out logical workflows without the manual drudgery of drawing. I’d love to hear how this fits into your academic or classroom workflow—your feedback will help us build a better tool for the education community! 🚀


Other tools
-
It is the ease of use for me. DataSquirrel is fast, the UI is super intuitive, and the guided analysis feature is highly convenient. I have officially moved from uploading CSV files from Google sheet to DataSquirrel. Within minutes, I can visualize my data and interpreting it becomes super simple.
-
i would say it gives the mind a sense of clarity
-
As a UX Researcher - this is an amazing tool to rank and classify various user comments and feedback.
- Spotlight:
 TendemTask automation
 -
It took me less than 20 minutes to create infographic perfection- all the other AI design sites I tried, and I tried them all, weren't able to give me what I wanted in 1 way or another. Outline Ninja helped me create my infographic
-
 Automate data work and reporting with AI Agents. No data|coding skills required.OpenSigned up for a pro account for Google Drive integration. Works great! Saves me a lot of manual excel work.
 -
This one was really nice. In that it could also generate a white paper to go with the diagram
-
I really like DataLine, but I'm kinda biased cause I built it.
- Didn't find the AI you were looking for?
-
-
-
-
 OpenReally great number pattern generator. We have taken your tool and made some advanced changes here - https://texttoolz.com/tools/number-pattern-generator
 -
-
Read the terms and conditions about data usage, not nice...
-
-
I had to tweak a few things to match my brand style, but overall it saved me a ton of time. Definitely handy if you need something fast and professional-looking.
-
Test based on an actual teaching topic of Social Media Marketing based on a textbook. Perhaps my prompt was not detailed enough because the .ppt output had a minimalist layout. Some textual explanations were acceptable however, the AI does not yet have enough depth to use for an education environment. The results were very fast and produced 12 slides. Images were presentation quality however, two images were repeated and the text-to-image ratio was only a 1/2 grid.
-
I felt there is need of more ready made templates. But, it does what it claims. I chose one question suggested by the AI agent, and it created the infographics in few seconds. It's cool. Saving it for future reference.
-
Great tool, offers a lot of data story suggestion and detailed charts.
-
 AI-powered paper writing in 2 minutes: bypass-AI, plagiarism-free, well-researched.OpenThe site is easy to use and has nice features (it suggests titles - it divides the search in a good way, making you choose the number of words you want to write in the search), but the problem is that it writes paragraphs without footnotes and without a list of references.
 -
-
-
Takes input (full presentation text in my case) as prompt and generates its own copy. Poor image quality. Boring layout. No bullets etc. You can try once with your free credits. no fun
-
It does exactly what is expected and more. I asked it to create a map with pins for 30 addresses and it did exactly that within a few seconds. It has great customization options also.
-
 Ask data questions, get instant insights, SQL, and charts — all poweredOpen
 -
-
Thank you for your feedback! Super excited to see how you get on with Bizzy!
-
-
It’s a powerful and intuitive tool that simplifies complex tasks, boosts productivity, and makes managing work smoother than ever. Highly recommended!
-
Displayr has become an essential tool for survey data analysis. By leveraging advanced AI integration, the platform offers a user-friendly, low-code solution for analyzing survey data. Users can efficiently create presentations while working on data analysis within the same interface, eliminating the hassle of transferring numbers from Excel to PowerPoint.
-
Using it on day-to-day basis to create presentations for my real estate clients. It's good.
-
-
-
 AI-powered Excel analysis and visualization in natural languageOpenTired of wrestling with complex formulas, spending hours cleaning data, and struggling to create the right charts? Excelmatic is a powerful web-based AI agent designed to revolutionize your relationship with spreadsheets.
 -
Looks promising but found it very slow to load and create templates and previews
-
asking for key, no usability without a paid subscription
-
-
I am able to summarize a complex paper into a one-pager visual. Before this tool: hours of reading and summarizing. After this tool: I grasp something complex in seconds. Thank you!!!
-
-
 Bring history to life with AI-generated visualizations.Open
 -
-
Created a dashboard using my Excel file and it gave insights I didn’t even expect. It can read any kind of Excel file no matter the template. I can even check the accuracy by tracing back which column the data came from Great tool. highly recommended!!
-
Parsers VC is an amazing tool that helps me predict investments and find the best venture matches. It has a lot of useful data and filters that make my research easier and faster. I’m very impressed by it!👏
-
Combines knowledge graphs with AI, reveals main topics and gaps in a discourse.
-
The conversation with the ai felt really nice. And the even the narrative part is well executed.
-
 AI infographic generator that turns blog posts into link magnetsOpen
 -
I was just trying to get a quick graph showing population evolution over the last 30 years, didn’t have the dataset ready, so I was hoping the tool could auto-fill something reasonable. But it literally gave me three values. Three?? For 30 years?? What kind of trend can I possibly see with that? If the tool offers to research the data, it should at least offer a full timeline. And when I pasted the data I found, it created a literally bar chart???
-
 Generate stunning AI images of futuristic musical idols.Open
 -
Says "free during testing," but keeps telling me I have insufficient credits. I also can't seem to find a way to delete my account.
-
Great tool for getting some initial information about your data, especially in the beginning phase when your main goal is to explore your data
-
Google Earth AI embraces a plethora of tasks. It helps in visualizing geographic data, guides in making advanced data mapping, and supports in 3D earth modeling. It also provides a platform for location-based services and remote sensing, while incorporating satellite imagery for detailed geospatial analysis.
-
Very powerful, it not only gets data magically for your nl question but also builds a nice visual tailored to that data. Impressive.
-
I’d say this is one of the best chatbots I’ve used so far. The side-by-side comparison view is super handy for spotting bias and made-up, and the custom bots actually have decent memory, which is rare. Just a heads up: no image generation or voice mode. Other than that, it’s pretty solid.
-
-
Such a powerful tool with free account, all your data analysis needs with an easy intuitive itnerface
-
it's wild how MLflow takes chaotic experiments and turns them into neat, tweakable apps.it's open source, dead-simple to install and crazy fast at loggin metrics. kudos to the dev :D
-
 Open
Open -
 Generate ultra-realistic satellite images with professional detail.Open
 -
Data narration and augmentation are valuable tools from datumfuse.ai
-
-
-
-
Every claim on this site starting with #1 Free use as many times as you like is false. Dont waste your time! "https://imagetovideoai.run/#:~:text=1,as%20you%20need.
-
Create and share Mermaid diagrams instantly in your browser
-
As a tattoo nerd who cares about solid guidance and clean cover-ups, this one is a surprisingly good jump-ogg. Great for "what can I make here" and getting three or four workable angles to bring to the shop.
-
I got some free credits to try the app when I signed up, I could create a few great infographics
-
 Transform molecular visualization requests into precise PyMOL commands.Open
 -
I run an early-stage startup. Arka has been pretty amazing for understanding our user adoption data (and then be able to ask follow up questions) in just a few clicks!


Post


